Last Updated on August 28, 2024 by Birth Facts
This page summarises the supporting evidence sources for my estimates of the risks for women’s health associated with different modes of delivery. Where possible, I have tried to use estimates given in systematic reviews or meta-analyses, which try to capture the weight of the literature on a topic rather than individual studies. I focus only on the risks in high income countries. The risks in low income countries may be different.
The discussion here will be more technical than on the page outlining the risks of different modes of delivery.
Absolute risk vs relative risk
In trying to capture the risks of different modes of delivery, I focus on absolute risk rather than relative risk. Relative risk tell you how much higher a risk is in one group compared to another. This is not very informative because it does not tell you how large the risk is overall.
For example, suppose it is true that walking around with a metal tipped umbrella increases your risk of being struck by lightning by 500%. This doesn’t tell you anything about how risky walking around with a metal tipped umbrella is. To know that, we need to know the risk of being struck by lightning without a metal umbrella. Since the risk of being struck by lightning is extremely small, increases in this relative risk don’t matter very much.
For this reason, on this website, I report absolute risks rather than relative risks. Absolute risk tells you how many of a certain types of outcome we should expect to see in a group of people. For instance, it says that for 1,000 women giving birth vaginally, around 200 will suffer stress urinary incontinence.
General notes about the evidence
Where possible in this evidence review, I use risk estimates from the UK National Institute of Clinical Excellence (NICE). NICE is a body that evaluates the risks of different medical interventions by surveying the empirical literature with the aim of finding high quality studies. NICE evaluations in turn determine prioritisation and informed consent policies in the UK National Health Service. The evidence reviewed by NICE typically focuses on high-income countries, and so is relevant to all high-income countries, not just the UK.
I use the NICE evaluation because NICE is an internationally respected global health body that carries out extensive, rigorous and publicly available evidence reviews of all medical procedures. I am not aware of a better resource written in English.
The drawbacks of NICE estimates, and in general the evidence in the field of birth trauma, are as follows:
- Many studies do not disaggregate different modes of delivery. In particular, for many potential risks, studies do not separate operative from unassisted vaginal delivery; different types of operative delivery (forceps or vacuum); different types of c-section (planned or unplanned). These all have importantly different risks.
- In particular, in its review of c-sections, NICE is answering a different question to the one I am answering here because it is primarily focused on the choice between planned vaginal birth and planned c-section, and not on the other possible modes of delivery.
- NICE does not evaluate many important risks, such as levator avulsion and pelvic organ prolapse. The reasons for this are unclear.
- Many studies report only relative risks, not absolute risks.
- Many studies only have small sample sizes or are biased for other reasons. NICE classes all of the studies used in its evidence review as low or very low quality (Table 7).
One important general issue with the literature on the risks of modes of delivery is that it is ethically and practically impossible or very difficult to run a randomised controlled trial on modes of delivery. Consequently, all of the studies are observational. This means that there are risks of confounding, which may be difficult to correct for. For example, women who are more likely to have an operative delivery or emergency c-section may be at greater risk of some bad outcomes independently of the mode of delivery. A study that attributes all of these bad outcomes to the mode of delivery would overstate the risk.
Observational studies use controls to correct for these confounders. There are two problems with this. First, controls may not properly correct for all potential confounders. So, the adjusted estimate might be biased.
Second, there is a risk that the controls themselves introduce bias if the control is not actually an independent cause of a particular outcome. For example, a study comparing operative delivery and emergency c-section might adjust for maternal income when assessing certain outcomes. But it might be that income only has an impact on the outcome because better off women are more likely to choose e.g. an operative delivery, rather than because income independently affects the outcome. If so, the control would introduce bias.
In spite of this, observational evidence is all we have, and in some cases clear conclusions can be drawn from it about the causal effects of different modes of delivery.
Problems with confounding
The problem of confounding is more serious for some injuries and morbidities than others.
Prior to labour, no-one plans to have a forceps or ventouse delivery or an unplanned c-section. These will only be performed if medically necessary or if the mother is too exhausted to give birth vaginally without assistance. Consequently, women who deliver in this way are likely at much greater risk even if that risk is not caused by those modes of delivery. Correlation is not causation. This means that it can be misleading to compare to compare the outcomes for these modes of delivery, and attribute any additional risk to those modes of delivery. However, the risk of confounding varies depending on the morbidity we are considering, and the mode of delivery we are comparing.
When risks are lower for c-section than unassisted vaginal birth
For some morbidities, (1) planned or unplanned c-section has lower risks than unassisted vaginal birth, and (2) there is a clear physical mechanism which explains why one mode of delivery might increase the risk of some form of injury.
For pain, urinary incontinence, pelvic organ prolapse, anal sphincter injury, and fecal incontinence, both planned and unplanned c-section has lower risks than unassisted vaginal delivery. This is strong evidence that unassisted vaginal birth causes this increased risk relative to c-section. The reason for this is that, if we strip out the causal effect of the mode of delivery, women who are more likely to have planned or unplanned c-section are at greater risk of injury than women who have unassisted vaginal birth. Adjusting for confounding would increase the risk attributable to unassisted vaginal birth relative to c-section.
Moreover, for many of these morbidities, there is a clear causal story for why c-section would decrease these risks. In the case of pain, since women who have c-section will have effective pain relief such as a spinal or an epidural and most women who have an unassisted vaginal delivery will not, there is a clear explanation for why pain would be lower during unplanned c-section. For the other morbidities, the damage stems from injury to the pelvic floor. C-sections reduce pelvic floor trauma because the baby does not have to pass through the vagina.
For all morbidities, the risks are always lower for unassisted vaginal birth than forceps and ventouse. Therefore, for the morbidities discussed above, c-section must also causally reduce those risks relative to ventouse and forceps.
When the risk of forceps is higher than ventouse
For all morbidities, the risk of forceps is similar to or greater than the risk of ventouse. The prospect that this is due to confounding seems small. There are two reasons for this. Firstly, decisions about whether to use forceps rather than ventouse are typically made on the basis of idiosyncratic practices at hospitals, rather than on the basis of medical need. For example, in many rich countries such as Sweden, Denmark and Finland, forceps are never used, while in other countries such as England, more than half of operative deliveries are via forceps (Muraca et al 2023, Fig. 2):
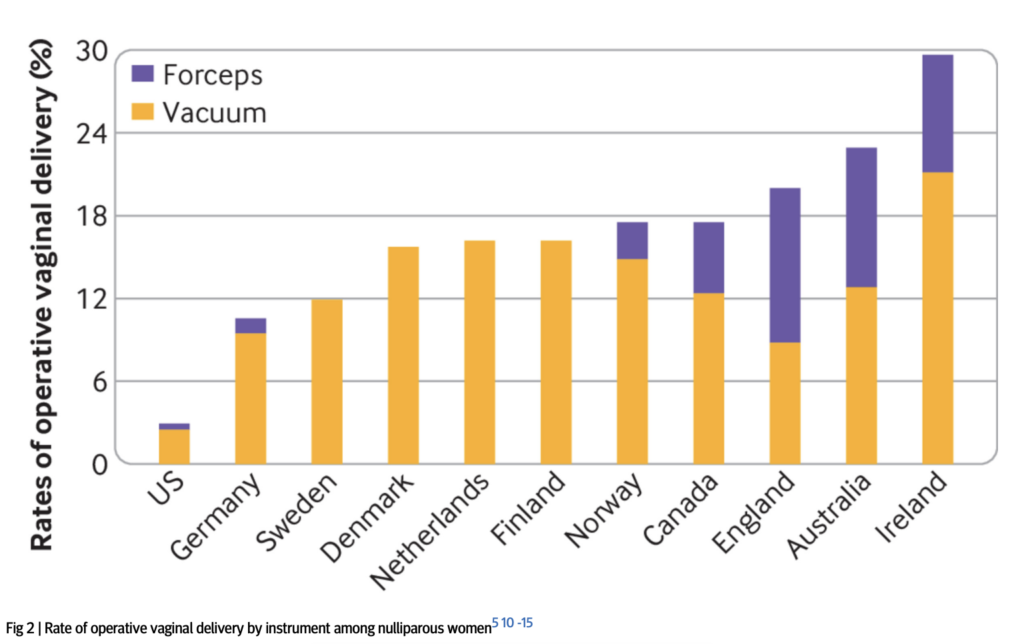
Women who have forceps delivery typically have the same medical indication to women who have ventouse delivery, though there may be minor exceptions to this.
Second, there is a clear causal explanation for why forceps increases the risk of some morbidities relative to ventouse. Forceps pose a greater risk of all of the morbidities associated with pelvic floor trauma. This is because the mechanics of securing the forceps on the baby’s head involves greater trauma to the pelvic floor than ventouse because forceps take up more space in the birth canal than ventouse.
When there is a clear causal explanation for why the risks of c-section would be higher than alternatives
For the risks from placenta praevia, obstetric wound hematoma, rupture of uterus in future pregnancy, infection of the uterus, and hysterectomy within one day of delivery, the risk is higher for both planned and unplanned c-section than the alternatives. For these morbidities, there is a clear causal story for how c-section of any kind would increase risk because they stem from the fact that c-section involves incision into the uterus whereas vaginal birth does not.
Maternal death
For maternal death, the issue of confounding when comparing forceps, ventouse and unplanned c-section to the alternatives is much more severe. Women who try to have an unassisted vaginal birth but are unable to are systematically different in important ways to women who have an unassisted vaginal birth or planned c-section.
Unplanned c-section is often done as a last resort in order to prevent severe harm to mother or baby. While women who have an unplanned c-section may be at higher risk of dying, the causal effect of unplanned c-section often reduces the mother’s risk of death relative to no intervention. The same goes for forceps and ventouse deliveries.
Summary of the evidence
Pain
The estimates for pain are from Schindl et al (2003), which is a study used by the 2021 UK National Institute of Clinical Excellence (NICE) guidance on the risks of different modes of delivery. Schindl (2021) is a survey of 1,050 women on their birth experiences. The relevant data on pain is from Figure 1a of that study:
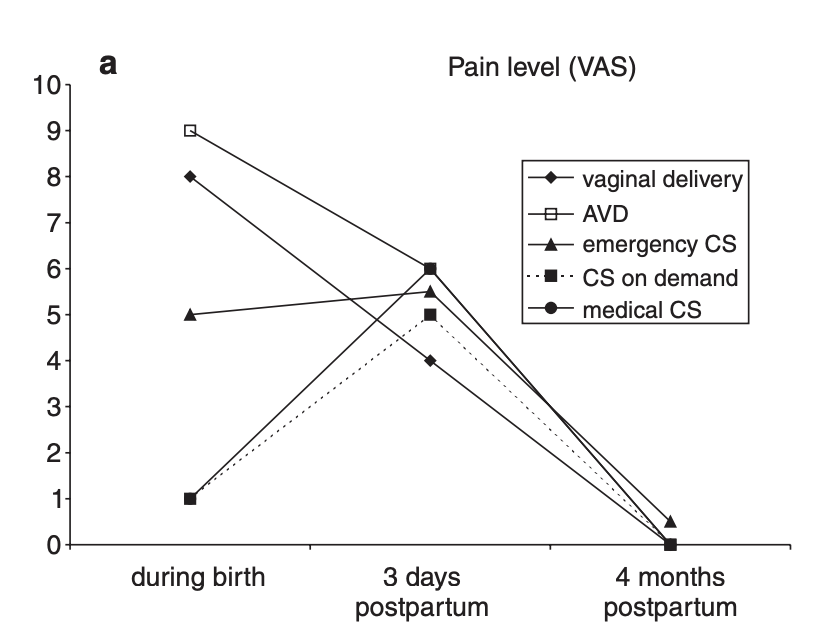
Schindl et al (2003) describes the findings on pain as follows:
“Peridural anesthesia for pain relief was offered to every woman before birth, but it was chosen by only 11%. Consequently, median pain level during birth was significantly higher in vaginal birth and AVD than in all other kinds of delivery and in emergency CS compared to other CS groups. At 3 days postpartum, the pain level was significantly lower after spontaneous vaginal delivery compared to all CS groups. There were no significant differences in pain levels between CS groups. At 4 months postpartum no difference in momentary birth-related pain was observed between all groups (Kruskal–Wallis test, p ¼ 0.192).”
NICE classes the evidence as “very low quality”.
Urinary Incontinence
The data on urinary incontinence is from the 2021 UK National Institute of Clinical Excellence (NICE) guidance on the risks of different modes of delivery. Table 3 in Appendix A of that document summarises the relative risks of caesarian versus vaginal delivery for urinary incontinence newborn mortality:
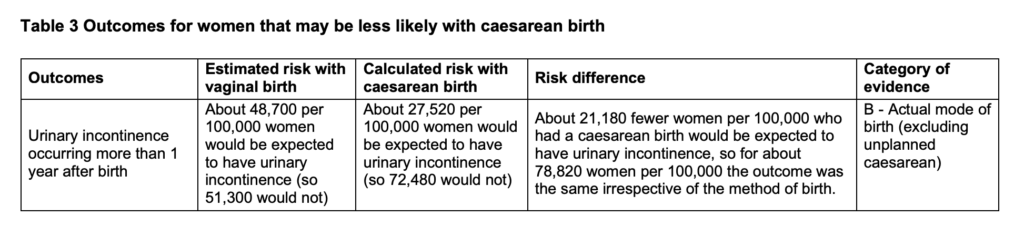
This source does not separate out the risks for vacuum delivery and forceps. I use the estimate for all vaginal delivery as my estimate for unassisted vaginal delivery. This likely slightly overstates the risks of unassisted vaginal birth because vacuum and forceps carry slightly higher risks of urinary incontinence.
NICE classes the evidence on urinary incontinence as of low and very low quality.
To estimate the risks for vacuum and forceps, I use Tahtinen et al (2016) ‘Long-term Impact of Mode of Delivery on Stress Urinary Incontinence and Urgency Urinary Incontinence: A Systematic Review and Meta-analysis’, European Urology. This is a systematic review and meta-analysis of the association between mode of delivery and stress urinary incontinence more than one year after first delivery.
This is somewhat imperfect because the meta-analysis only provides a clear estimate of risk for stress urinary incontinence, even though that is only one type of incontinence (the other being urge urinary incontinence). Nevertheless, since stress urinary incontinence is more prevalent than urge urinary incontinence, this error is unlikely to be too large:
To calculate the absolute risk increase of moderate or severe [stress urinary incontinence] or [urge urinary incontinence] with vaginal birth, we estimated the absolute risk of [stress urinary incontinence] or [urge urinary incontinence] after cesarean section using two large population-based studies [25,26]: 12.2% for moderate or severe [stress urinary incontinence] and 10.1% for moderate or severe [urge urinary incontinence] after any cesarean section, and 5.0% for [stress urinary incontinence] after elective cesarean section, and then used the odds ratio (OR) to calculate the absolute risk increase with vaginal delivery
The relevant data on the relative risks of vacuum and forceps is on page 154 of the paper:
The results were similar when comparing vacuum with spontaneous vaginal delivery (two studies, both high risk of bias; aOR: 1.10; 95% CI, 0.80–1.51; heterogeneity: p = 0.60; I2 = 0%) [31,38] or forceps to spontaneous vaginal delivery (three studies, two low and one high risk of bias; aOR: 1.16; 95% CI, 0.71–1.89; heterogeneity: p = 0.06, I2 = 65%) [5,34,38].
Pelvic organ prolapse
The prevalence of pelvic organ prolapse varies strongly across studies with different methodologies. Weintraub et al (2020) report that
“The reported prevalence of POP is highly varied according to different studies and is found to be anywhere between 3% and 50%. These wide variations are due to differences in study design, inclusion criteria, and accompanying indicator symptoms used among studies. For example, studies that are based on telephone surveys without a gynecological examination rely on the subjective bulge sensation reported by women and estimate the prevalence of POP to be between 2.9% and 8.3%… In contrast, in other studies that are based on an objective gynecological examination with no regard to women’s subjective symptoms, the prevalence of any POP is reported to as high as 50%.”
There is, then, a difference between symptomatic pelvic organ prolapse and pelvic organ prolapse as diagnosed by physical gynaecological examination.
Symptomatic pelvic organ prolapse
Symptomatic pelvic organ prolapse is plausibly a more important predictor of a detrimental effect on wellbeing than is pelvic organ prolapse that women do not notice. I therefore separate these two outcomes in my analysis.
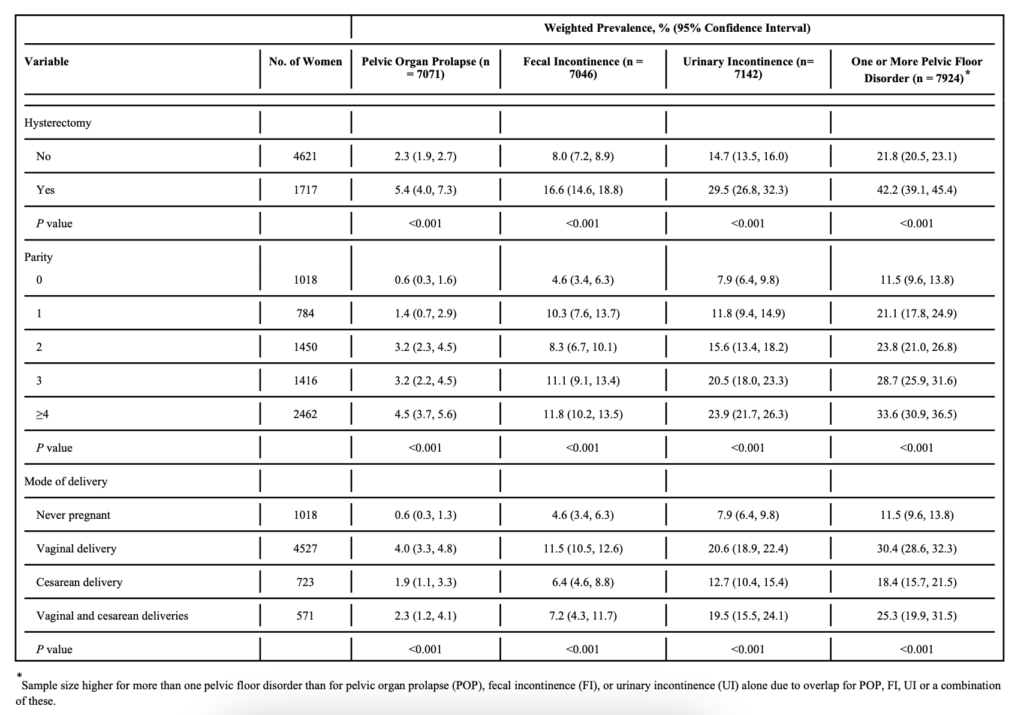
I take the prevalence of symptomatic pelvic organ prolapse for unassisted delivery from Wu et al (2014) ‘Prevalence and Trends of Symptomatic Pelvic Floor Disorders in U.S. Women’, Obstet Gynecol. This is a study of 7,924 women over the age of 20 in the United States. For women having unassisted vaginal birth, the prevalence of symptomatic pelvic organ prolapse is 4% (Table 1).
This is broadly consistent with other studies on the prevalence of pelvic organ prolapse in the wider population and among people having unassisted vaginal birth (see for example Weintraub et al (2020) above, Tegerstedt et al (2005), and Handa et al (2013)).
Handa et al (2013) is used by the UK National Institute of Clinical Excellence and finds that the prevalence 5-10 years after birth is as follows:
- Unassisted vaginal: 3%
- Operative delivery (vacuum or forceps): 7%
- Planned c-section: 2%
However, the sample for these outcomes is very small.
Gyhagen et al (2013), a study of 5,236 Swedish women finds markedly higher prevalence for all modes of delivery:
“Prevalence of sPOP was higher after vaginal delivery compared with caesarean section (14.6 versus 6.3%)” (page 152)
I use the Wu et al (2014) estimate because it is more in line with findings in other studies, though ultimately there is some uncertainty about this number.
Unfortunately, Wu et al (2014) does not report the risks of forceps and ventouse, so to calculate that I calculate those effects using the relative risk estimates in Cattani et al (2021), ‘Pregnancy, labour and delivery as risk factors for pelvic organ prolapse: a systematic review’, International Urogynecology Journal. Cattani et al (2021) is a systematic review of the literature on the effects of different modes of delivery on different health outcomes.
The relative risks of different modes of delivery for symptomatic pelvic organ prolapse are reported in Figures 1, 4 and 7.
- Unassisted vaginal delivery increases the risk of symptomatic prolapse by 2.6x relative to c-section (Figure 1).
- Forceps increases the risk of symptomatic prolapse by 2.5x relative to unassisted vaginal delivery (Figure 4).
- Ventouse increases the risk of symptomatic prolapse by 1.06x relative to unassisted vaginal birth (Figure 7).
We can calculate the absolute risks of these different modes of delivery by multiplying the prevalence of symptomatic prolapse for unassisted birth by the above figures.
Cattani et al (2021) does not disaggregate planned and unplanned c-sections, though there is some evidence that the risks are likely to be similar. Handa et al (2011), which is used by the UK National Institute of Clinical Excellence finds that rates of symptomatic prolapse are similar between planned and unplanned c-section, with unplanned c-section slightly lower, though the sample is small (see Table 3).
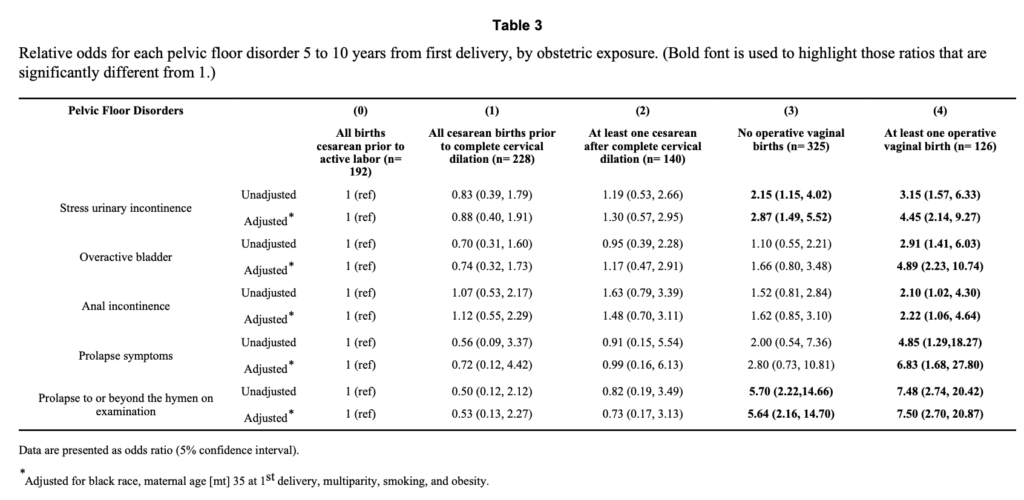
Given the limited data, I assume that the rate of prolapse symptoms is the same between planned and unplanned c-section.
Clinically diagnosed pelvic organ prolapse
The estimates for the prevalence of clinically diagnosed prolapse for unassisted delivery are from Blomquist et al (2018), ‘Association of Delivery Mode With Pelvic Floor Disorders After Childbirth’, JAMA. Blomquist et al (2018) is a cohort study of 1,528 women in a community hospital in the United States who were followed up annually for nine years. Pelvic organ prolapse “was assessed via physical examination using the Pelvic Organ Prolapse Quantification System (POP-Q), and was defined as descent of the vaginal walls or cervix beyond the hymen during the Valsalva maneuver (ie, bearing down as if having a bowel movement)”.
For unassisted vaginal delivery, the prevalence of pelvic organ prolapse was 30%:
“For spontaneous vaginal delivery (reference), the 15-year cumulative incidences of pelvic floor disorders after first delivery were as follows: … [Pelvic Organ Prolapse], 30.0% (95% [Confidence Interval], 25.1%-34.9%)”
Absolute risks for the other modes of delivery are calculated from Cattani et al (2021). The relative risks of different modes of delivery for clinically diagnosed prolapse are in Table 1:
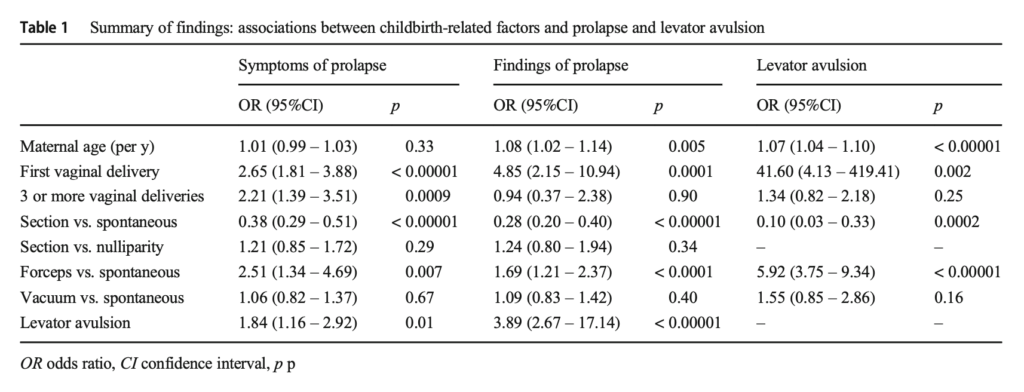
The absolute risks of different modes of delivery can then be calculated in the same way as the estimates for symptomatic prolapse above.
Cattani et al (2021) does not disaggregate planned and unplanned c-sections, though there is some evidence that the risks are likely to be similar. For example, Volloyhaug et al (2015) finds similar rates of clinically diagnosed prolapse for planned and unplanned c-sections albeit with a very small sample
“The study was not sufficiently powered to determine differences between elective (n = 23) and acute (n = 78) Cesarean deliveries, but no difference was found in POP prevalence (2/23 and 4/78, respectively) and hiatal areas were similar in the two Cesarean subgroups.”
Handa et al (2011), which is used by the UK National Institute of Clinical Excellence finds that rates of diagnosed prolapse are slightly lower for unplanned c-sections vs planned c-sections, though again the sample is small (see Table 3).
Given the limited data, I assume that the rates of clinically diagnosed prolapse are the same for planned and unplanned c-sections.
For reasons that are unclear, the UK National Institute of Clinical Excellence does not evaluate the risk of pelvic organ prolapse.
Levator avulsion
Dietz et al (2015) claims that:
“The muscle forming this opening has to undergo a degree of distension that would rupture any other skeletal muscle, and it is surprising that major trauma occurs in only 10–20% of all primiparae after normal vaginal delivery or vacuum. This figure rises to 30–65% after forceps”
The citation for this is to Dietz H. ‘Pelvic floor trauma in childbirth’. Aust NZ J Obstet Gynaecol 2013;53:220–30. Pages 224-5 of this study cites a variety of studies on the incidence of levator avulsion for different delivery methods.
A meta-analysis by Rusavy et al (2021) broadly supports these estimates, and form the basis of the estimates we use:
“Incidence rates of [levator avulsion] were 1, 15, 21, 38.5 and 52% following caesarean, spontaneous, vacuum, spatula and forceps births, respectively, with no differences by imaging modality”
Rusavy et al (2021) is a meta-analysis of 37 primary non-randomised studies from 17 countries and involving 5,594 women. Studies could be included if they assessed levator avulsion with imaging after the first birth.
Rusavy et al (2021) does not report rates of levator avulsion for unplanned c-sections. The rates they report are for both planned and unplanned c-section. Other studies that include both planned and unplanned c-sections find that the risk of avulsion for any kind of c-section is 0 or very low. For example, Caudwell-Hall et al (2017) and Volloyhaug et al (2015) found no avulsions for either planned or unplanned c-sections. This makes intuitive sense given that the strain on the pelvic floor is lower for any kind of c-section. Thus, I assume that the avulsion rate is the same for planned and unplanned c-sections.
For reasons that are unclear, the UK National Institute of Clinical Excellence does not evaluate the risk of levator avulsion.
Anal Sphincter Injury
The data on risk factors for anal sphincter injury during childbirth are from Guzman Rojas et al (2017) ‘Anal sphincter defects and fecal incontinence 15–24 years after first delivery: a cross-sectional study’, Ultrasound in Obstetrics and Gynecology. This was a cross-sectional study including 563 women who delivered their first child between 1990 and 1997. Women delivering in this period filled out a pelvic disorder distress survey. The women were then examined by ultrasound for anal sphincter injuries 15-24 years after first delivery.
Ultrasound examination is important because diagnosis by obstetric care provides tends to underdiagnose anal sphincter injury. This is discussed on page 1135 of Harvey et al (2015) for the Society of Obstetricians and Gynaecologists of Canada (‘OASIS’ refers to Obstetric anal sphincter injury):
“Overall, studies looking at the incidence of OASIS based on the WHO’s International Classification of Diseases12 report an incidence of 4% to 6.6% of all vaginal birth, with higher rates in assisted deliveries (6%) than in SVD (5.7%). An OASIS is often misdiagnosed at the time of delivery by obstetrical care providers. One study reported that the overall rate of missed OASIS ranged from 26% to 87%. In that study of primiparous women, all women were examined by a trained fellow after the examination and grading of tear by the obstetrical care provider and confirmed by endoanal ultrasound prior to repair (considered the gold standard). When examined systematically as described above, all but 1.6% (3/182) of women were correctly diagnosed on exam; the other 3 had occult OASIS representing the falsenegative rate of examination, 2 of which only affected the internal sphincter, and would have thus been undetectable on physical examination. When the diagnosis of OASIS is obtained from endoanal ultrasound evaluation within 2 months of delivery, the incidence of any degree of anal sphincter defect in primiparous women is reported to be as high as 27% to 35%, and between 4% and 8.5% of multiparous women have a new sphincter defect.”
Guzman Rojas et al (2017) reports the absolute risk of different delivery modes in the abstract:
“Defects of [External Anal Sphincter] and [Internal Anal Sphincter] were found after [Unassisted vaginal delivery] (n=201) in 10% and 1% of cases, respectively, after [Forceps delivery] (n=144) in 32% and 7% of cases and after [Vacuum delivery] (n=120)in 15% and 4% of cases. No defects were found after [Caesarian Section] (n=98).”
Guzman-Rojas (2017) does not disaggregate anal sphincter injuries for planned and unplanned c-section.
Shamsa et al (2013) is a study of nearly 1 million women giving birth in Australia. That study also does not disaggregate planned and unplanned c-sections but finds that the rate of anal sphincter injury is zero for any type of c-section (Table 2). Since this study is so large, this suggests that the rate of anal sphincter injury for any type of c-section is zero. Since the pelvic floor and perineum are under much less stress in c-section deliveries, this makes intuitive sense.
Fecal incontinence
The estimates for fecal incontinence are from the UK National Institute of Clinical Excellence (NICE) and studies cited by them. The Institute notes that more than 1 year after birth, the prevalence of fecal incontinence among women who have a planned c-section is 74 per 1,000 (Table 3 here):
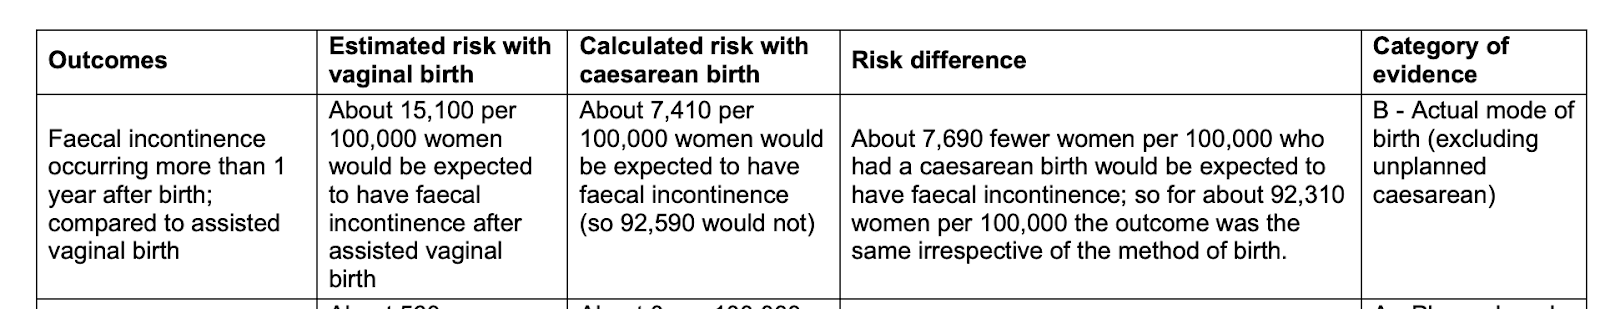
The Institute also gives an odds ratio for planned c-section relative to unassisted vaginal birth of 0.71 (Table 8 of the evidence review p. 117).
The National Institute of Clinical Excellence does not disaggregate the effects of forceps, vacuum and emergency c-section. So, to calculate those figures I use MacArthur (2011) ‘Exclusive caesarean section delivery and subsequent urinary and faecal incontinence: a 12-year longitudinal study’ BJOG and Handa et al (2011) ‘Pelvic floor disorders 5-10 years after vaginal or cesarean childbirth’ Obstet Gynecol. Both of these studies are used in the NICE evidence review.
Macarthur (2011) is a study in the UK New Zealand of 3,763 women who were followed up at 12 years. They disaggregate the risks of forceps and vacuum. Their findings are shown in Table 3:
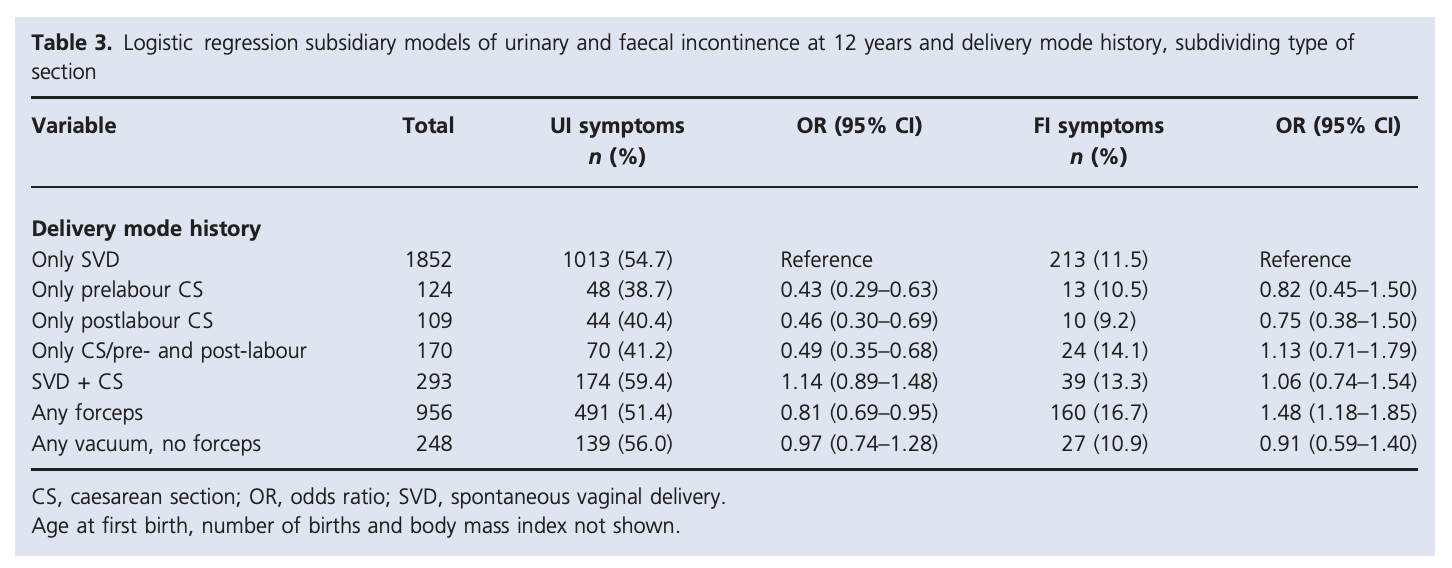
I use the odds ratios here to calculate the effect of forceps and vacuum deliveries.
Both MacArthur (2011) and Handa et al (2011) provide estimates for the effects of emergency c-section. Handa et al (2011) finds that emergency c-section before full cervical dilation has the same risks as planned c-section, but c-section after full cervical dilation has higher risks than planned c-section. As shown in the table above, MacArthur et al (2011) finds that the risk for unplanned c-section is slightly lower than planned c-section, though in both cases the sample size is small. I therefore assume that the risk is the same for planned and unplanned c-section.
These estimates for fecal incontinence are broadly in line with estimates one can infer from Guzman-Rojas (2017) mentioned above. Guzman Rojas (2017) does not report the absolute risk of fecal incontinence for different modes of delivery but it can be calculated from the data they present. Table 3 shows the risk of fecal incontinence for different types of anal sphincter injury:
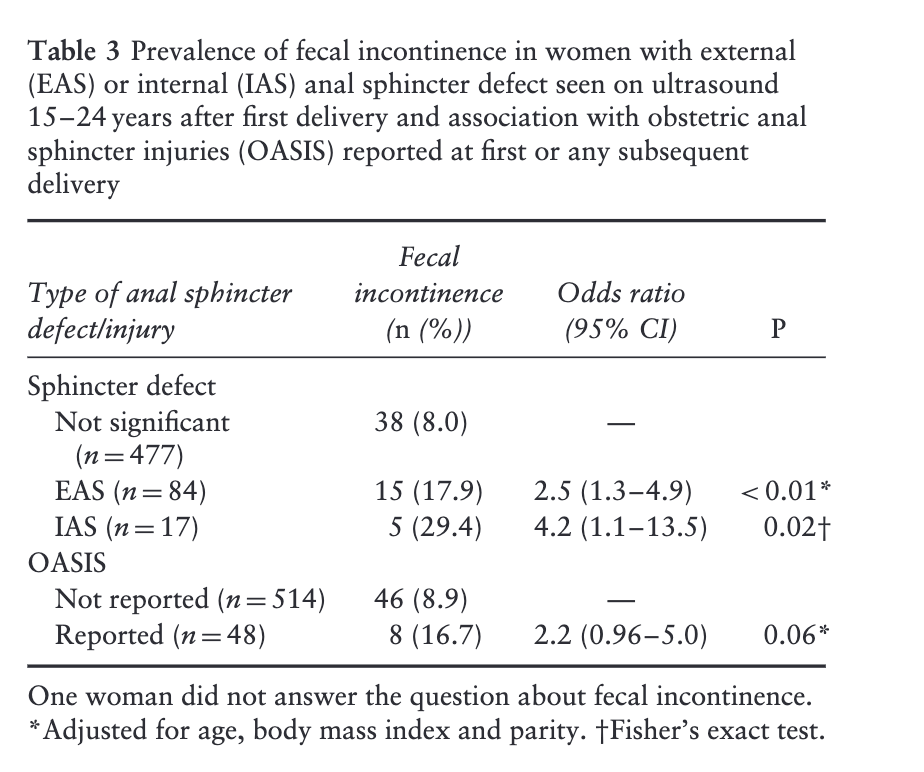
If you combine the data here with the data in their Table 2, you get similar risk estimates for the different modes of delivery.
The results are also broadly in line with Gyhagen et al (2014), a study of 5,236 women in Sweden. This study finds that the prevalence of fecal incontinence after vaginal delivery is 14.5% and after caesarian is 10.6%. This suggests that the prevalence is higher than in the estimate I give. However, Gyhagen et al (2014) also do not separate out the effect of forceps and vacuum.
Placenta praevia in future pregnancy
The literature on placenta praevia in future pregnancy broadly agrees that for women who deliver vaginally, 3-4 women will suffer praevia in the second pregnancy, whereas for women who have a c-section, 6-8 women will suffer placenta praevia in the second pregnancy. I have been unable to find studies that separate out the effects of forceps and vacuum delivery. The literature points to the conclusion that c-section is the main mode of delivery-related risk factor for future placenta praevia.
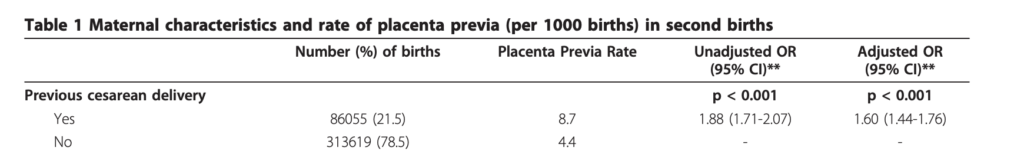
I use the estimate from Gurol Urganci (2011) ‘Risk of placenta previa in second birth after first birth cesarean section: a population-based study and meta-analysis’, BMC Pregnancy and Childbirth. In a cohort study of nearly 400,000 births Gurol-Urganci (2011) found that “The rate of placenta previa at second birth was 4.4 per 1,000 births for women with vaginal delivery at first birth”. After adjusting for confounders, they found for people who delivered via c-section at first birth, the rate of praevia at second birth was 7 per 1,000 births (see Table 1):
Gurol Urganci (2011) also conducted a meta-analysis of 37 studies including more than 12 million births found that c-section increased the risk by around 2.2.
This is in line with other large studies of praevia. For example, Keag et al (2018), a meta-analysis of 10 studies including 7.1 million births found that:
“Women with previous cesarean delivery had increased odds of having placenta previa compared to women with a previous vaginal delivery (5,039/1,025,692 previous cesarean delivery versus 16,679/6,076,000 previous vaginal delivery; OR 1.74, 95% confidence intervals 1.62 to 1.87, p < 0.00001; I 2 = 55%; 10 studies)”
So, for vaginal the risk is 2.7 per 1,000 births in future pregnancy, and for c-section, the risk is 5 per 1,000 births in future pregnancy. This study is used by the UK National Institute of Clinical Excellence.
Ananth et al (1997), a meta-analysis of 36 studies of 3.7 million births found that around 4 in 1,000 women suffered praevia, and that previous c-section increases the risk by around 2.6x.
These studies include both planned c-section and unplanned c-sections. So, I assume that the risk is the same for both of these modes of delivery.
Obstetric wound hematoma
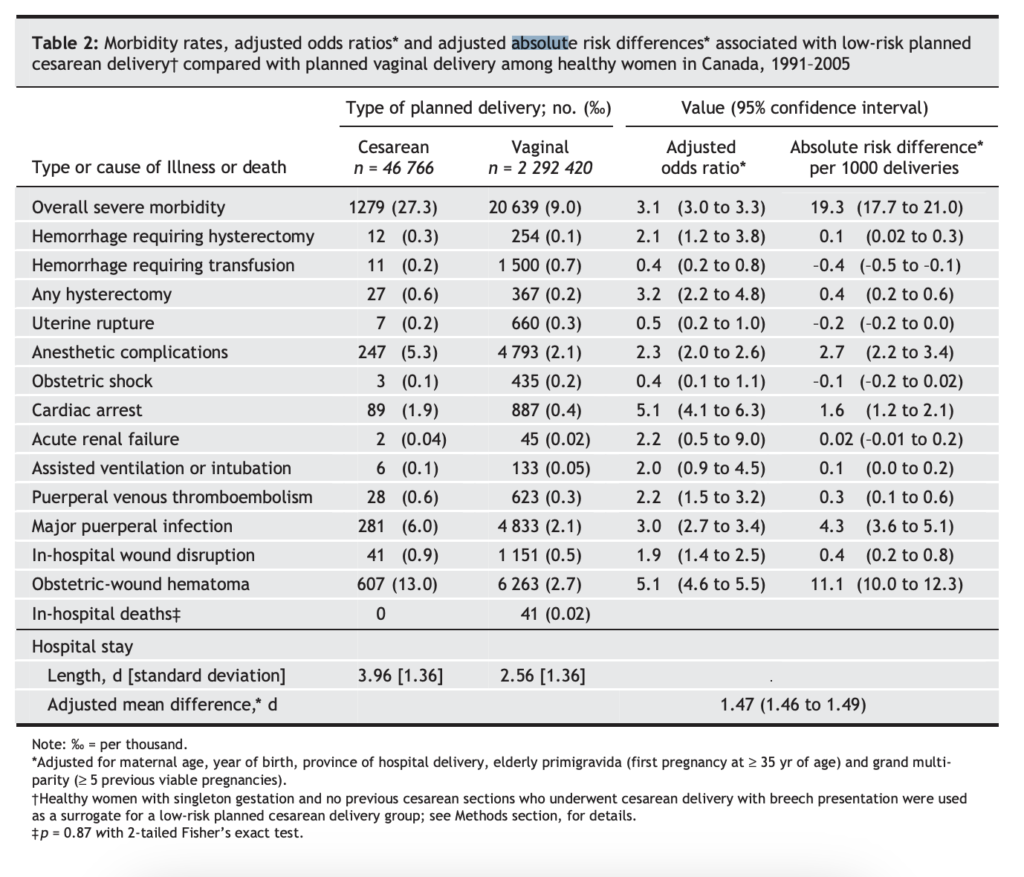
The data on obstetric wound hematoma is from Liu et al (2007) ‘Maternal mortality and severe morbidity associated with low-risk planned cesarean delivery versus planned vaginal delivery at term’, Canadian Medical Association Journal. This was a retrospective population-based cohort study of all women in Canada (excluding Quebec and Manitoba) who delivered from April 1991 through March 2005. The planned cesarean group comprised 46 766 women v. 2 292 420 in the planned vaginal delivery group.
Unfortunately, the study does not disaggregate outcomes for forceps, ventouse and unassisted vaginal delivery, instead grouping all of these under ‘vaginal delivery’. I therefore assume that all of these outcomes are the same for these three modes of delivery, which, for this outcome, probably somewhat understates the risk of forceps and ventouse, but not so much as to bring the risks close to those of c-section. The relevant data is in this figure:
This study only focuses on planned c-sections, not unplanned c-sections.
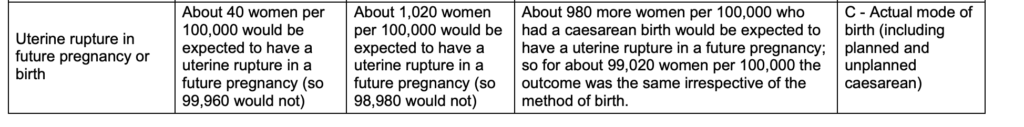
Rupture of uterus in future pregnancy or birth
The data on uterine rupture is from the 2021 UK National Institute of Clinical Excellence (NICE) guidance on the risks of different modes of delivery. Table 1 in Appendix A of that document summarises the relative risks of caesarian versus vaginal delivery for rupture of the uterus in future births:
The basis for this estimate is summarised in the National Institute of Clinical Excellence Evidence Review A document on the risks of caesarian birth, and refers to Keag et al (2018) ‘Long-term risks and benefits associated with cesarean delivery for mother, baby, and subsequent pregnancies: Systematic review and meta-analysis’, PLOS Medicine.
NICE classes the evidence as “very low quality”.
Keag et al (2018) includes both planned and unplanned c-sections and does not provide disaggregated analysis for these outcomes. So, I assume that the risk is the same for both planned and unplanned c-sections.
Infection of uterus and surrounding areas
The estimate for infection of the uterus is calculated in the same way as for obstetric wound hematoma using Liu et al (2007).
Placental accreta
The estimate for plancental accreta is from de Mucio et al (2019) ‘A systematic review and meta-analysis of cesarean delivery and other uterine surgery as risk factors for placenta accreta‘, Gynecology & Obstetrics. This is a meta-analysis of 16 studies including 1.34 million women.
The relevant data on absolute risk is in Figure 4
Figure 4. Absolute risk of placenta accreta by number of previous cesarean
deliveries (per 10 000 deliveries).
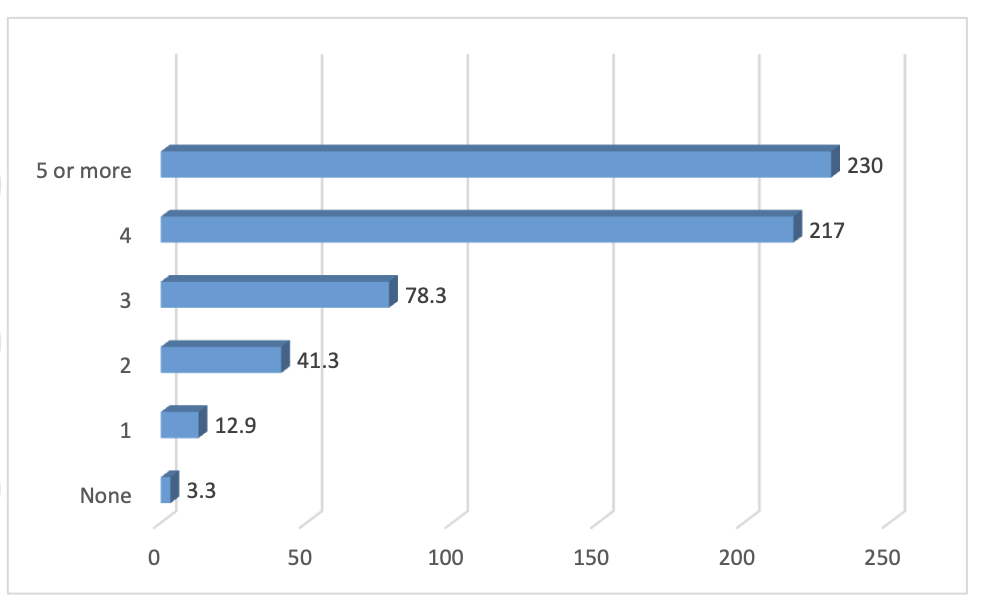
These estimates are very close to those found by the 2021 UK National Institute of Clinical Excellence guidance on the risks of different modes of delivery:
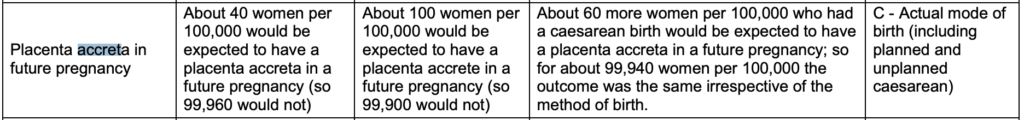
NICE classes the evidence as “very low quality”.
Both of these analyses include both planned and unplanned c-section. So, I assume the risk is the same for both of these modes of delivery.
Peripartum hysterectomy
The data on peripartum hysterectomy is from the 2021 UK National Institute of Clinical Excellence (NICE) guidance on the risks of different modes of delivery. Table 1 in Appendix A of that document summarises the relative risks of caesarian versus vaginal delivery for peripartum hysterectomy:
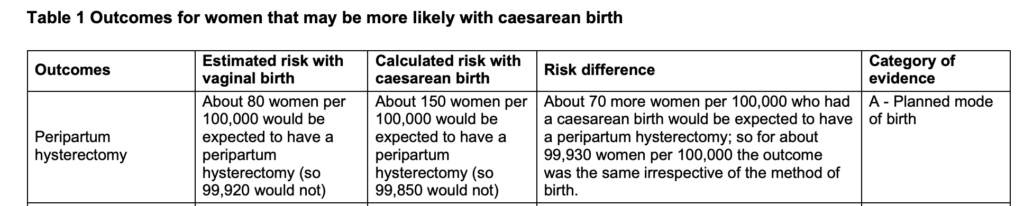
The basis for this estimate is summarised in the National Institute of Clinical Excellence Evidence Review A document on the risks of caesarian birth, and refers to Lavecchia et al (2016) ‘Effect of Planned Mode of Delivery in Women with Advanced Maternal Age’. Matern Child Health J.
NICE classes the evidence as “low quality”.
Maternal death
As noted at the top of this page, the issue of confounding is severe for the risk of maternal death.
The estimates for maternal death are from the 2021 UK National Institute of Clinical Excellence (NICE) guidance on the risks of different modes of delivery. Table 2 in Appendix A of that document summarises the relative risks of planned c-section versus planned vaginal delivery for maternal death:
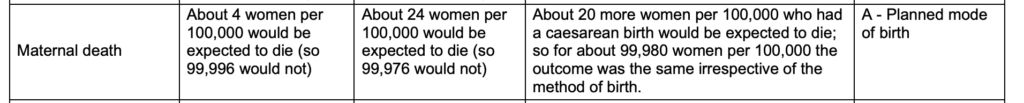
NICE classes the evidence as “low quality”.
Other studies suggest that the risk from planned c-section is somewhat lower. For instance, American College of Obstetricians and Gynecologists, Safe Prevention of the Primary Cesarean Delivery, ‘Safe Prevention of the Primary Cesarean Delivery’, March 2014, Table 1:
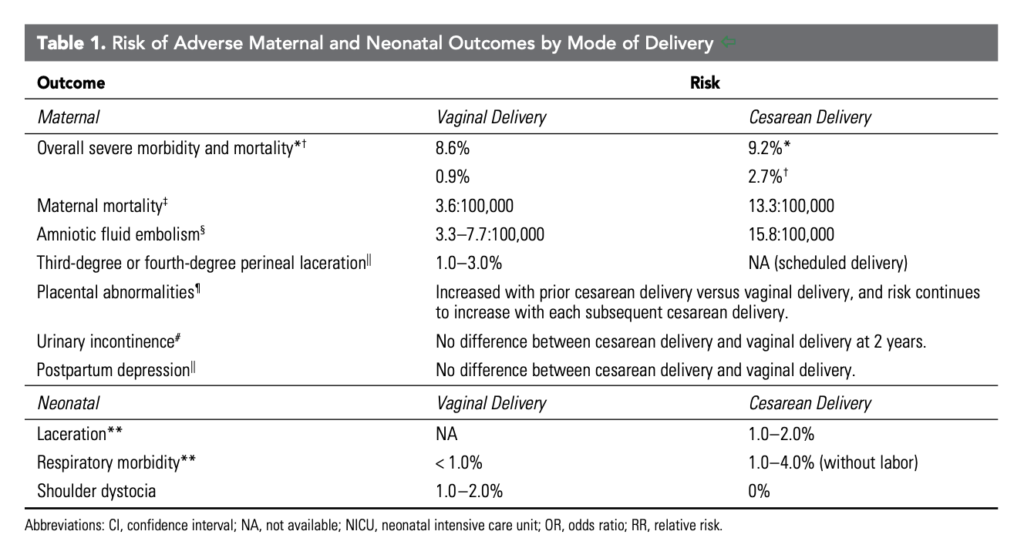
The estimate in this table for maternal mortality is from Deneux-Tharaux et al (2006) ‘Postpartum Maternal Mortality and Cesarean Delivery’, Obstetrics & Gynecology, which is a study of all births in France between 1996 and 2000. The odds ratios reported in the paper for different modes of delivery are shown in the table below:
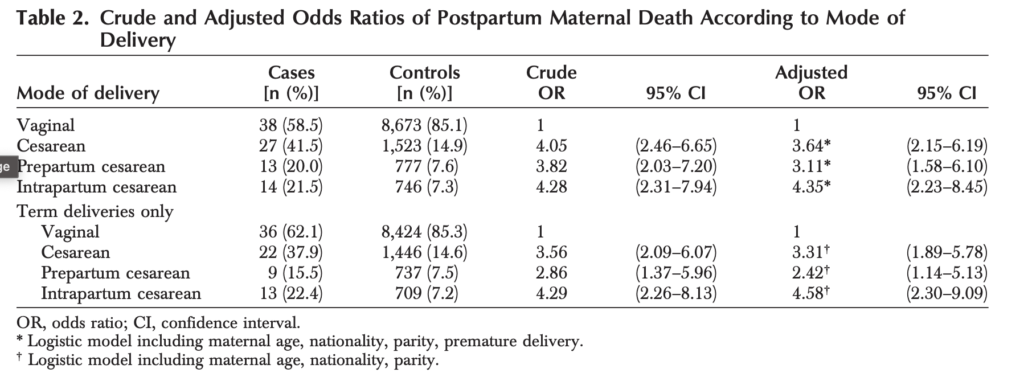
The table disaggregates the risk for planned and unplanned c-section, and attempts to adjust for confounders. This suggests that the risk of planned c-section is 3.6 times higher than vaginal delivery (including unassisted and operative delivery), rather than more than 6 times higher, as estimated by NICE.
Balayla et al. (2022) is a study of millions of hospitalisations in the US from 2005 to 2014. They estimate odds ratios for maternal mortality for different modes of delivery in Table 4.
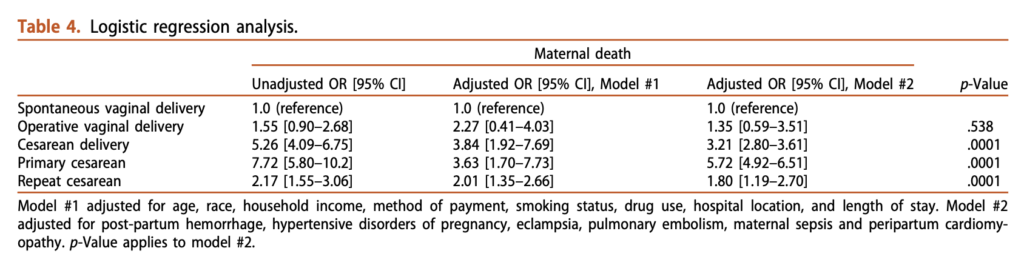
The odds ratios for c-section are similar to Deneux-Tharaux (2006). The adjusted odds ratio for operative delivery is 1.35x relative to unassisted vaginal delivery. However, adjusting for confounders here is very difficult.